PostgreSQL monitoring with Prometheus is an easy thing to do thanks to the PostgreSQL Exporter.
PostgreSQL is an open-source relational database with a powerful community behind it. It’s very popular due to its strong stability and powerful data types.
In this article, you’ll learn the top 10 metrics in PostgreSQL monitoring, with the following steps:
- Check if PostgreSQL is running
- Postmaster Service Uptime
- Replication lag
- Database size
- Available storage
- Available connections
- Latency
- Cache
- Memory available
- Requested buffer checkpoints
Also, we encourage you to download our Top 10 PostgreSQL monitoring metrics cheat sheet to dig deeper on how to monitor PostgreSQL with Prometheus.
Top 10 metrics in PostgreSQL monitoring
Availability
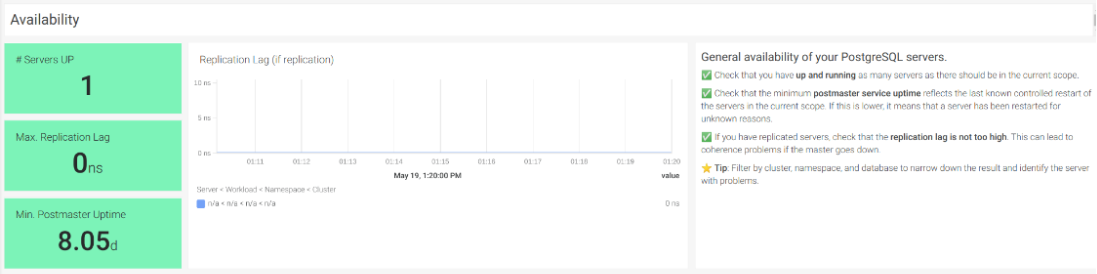
#1 Check if PostgreSQL is running
Checking that your PostgreSQL instance is up and running should be the first step in PostgreSQL monitoring. The exporter will monitor the connection and availability of the PostgreSQL instance. The metric of monitoring PostgreSQL availability is pg_up.
Let’s create an alert that triggers if the PostgreSQL server goes down.
pg_up == 0
#2 Postmaster Service Uptime
Also, it’s important to assure that the minimum postmaster service uptime reflects the last known controlled server restart. Otherwise, it means that a server has been restarted for unknown reasons. The metric of monitoring PostgreSQL availability is pg_postmaster_start_time_seconds.
Let’s create an alert to notify if the PostgreSQL server was restarted without a known reason in the last hour (3600 seconds).
time() - pg_postmaster_start_time_seconds < 3600
Replication
#3 Replication lag
In scenarios with replicated PostgreSQL servers, a high replication lag rate can lead to coherence problems if the master goes down. The metric of monitoring PostgreSQL availability is pg_replication_lag.
Let’s create an alert that triggers if the replication lag is greater than 10 seconds.
pg_replication_lag > 10
Storage
Running out of disk is a common problem in all databases. It also can cause the Write Ahead Log (WAL) to be unable to write on disk. This could end up in transaction issues affecting persisting data.
Luckily, it’s also a very easy thing to monitor. We will check the database size, and the disk available.
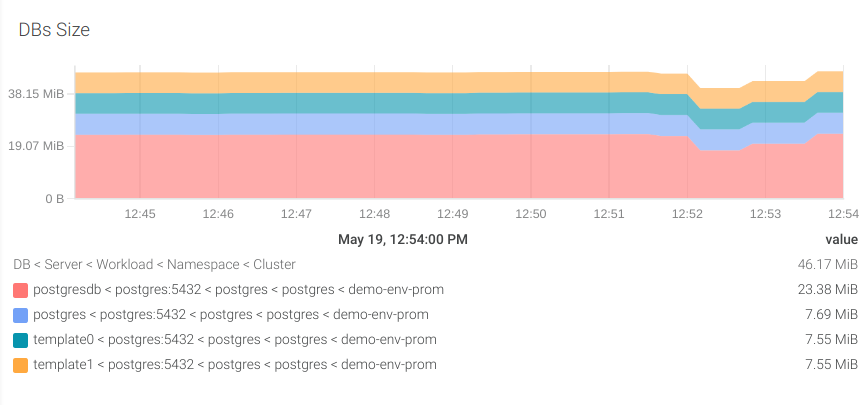
#4 Database size
First, let’s figure out what is the storage usage of each of the PostgreSQL databases in our instance. For this, we’ll use the pg_database_size_bytes metric.
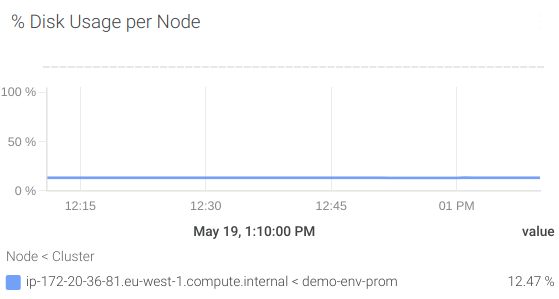
#5 Available storage
It depends on how you run your PostgreSQL instance:
Kubernetes
You can use the node_filesystem_free_bytes metric from the node_exporter. You may remember when we predicted the future in our getting started PromQL guide.
Let’s create an alert to notify us when we are going to have less than 1 Gb in the next 24 hours.
predict_linear(node_filesystem_free_bytes[1w], 3600 * 24) / (1024 * 1024 * 1024) < 1
AWS RDS PostgreSQL
Cloud-managed database solutions, like AWS RDS, are getting more and more popular. If you are running an AWS RDS PostgreSQL instance, you can monitor it through CloudWatch and the YACE exporter.
You can use the aws_rds_free_storage_space_average metric. Let’s create an alert if you’re going to run out of storage in the next 48 hours.
predict_linear(aws_rds_free_storage_space_average[48h], 48 * 3600) < 0
Networking
If you had to keep just one networking metric, it should be the available connections.
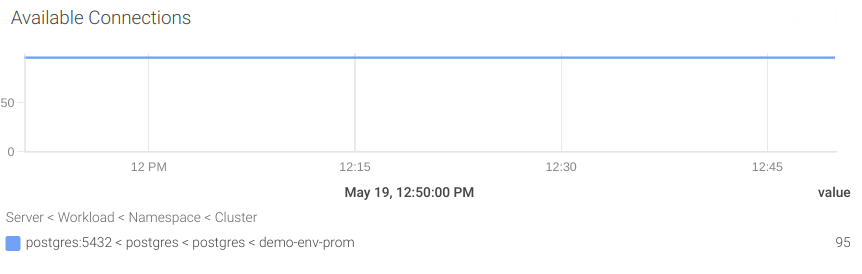
#6 Number of available connections
We are going to calculate the available connections by subtracting the superuser reserved connections (pg_settings_superuser_reserved_connections) and the active connections (pg_stat_activity_count) to the maximum number of connections (pg_settings_max_connections).
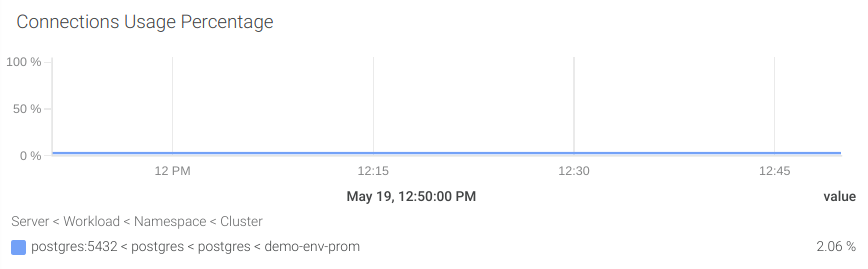
Let’s create an alert to notify if the number of available connections is under 10 percent of the total.
((sum(pg_settings_max_connections) by (server) - sum(pg_settings_superuser_reserved_connections) by (server)) - sum(pg_stat_activity_count) by (server)) / sum(pg_settings_max_connections) by (server)) * 100 < 10
Performance
Checking performance in any database means keeping an eye on CPU and memory.
When a server runs out of memory, it can lead to more CPU load. Fortunately, some indicators warn us if memory usage needs to be optimized.
#7 Latency
First, we are going to measure performance by calculating how much time it takes to get the results from the slowest active transaction. To do that, we’ll use the pg_stat_activity_max_tx_duration metric.
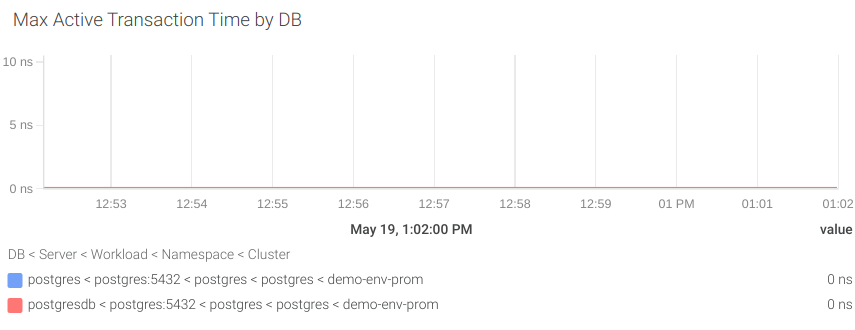
Let’s create an alert that notifies us when the active transaction takes more than 2 seconds to complete.
pg_stat_activity_max_tx_duration{state="active"} > 2
#8 Cache hit rate
Low latency can be a consequence of problems with cache in memory, which increments disk usage, so everything is slower.
For analyzing the cache hit rate, we’ll check the in-memory transactions (pg_stat_database_blks_hit) and the transactions running in disk (pg_stat_database_blks_read).

Let’s create an alert when the cache hit rate is lower than 80 percent.
100 * (rate(pg_stat_database_blks_hit[$__interval]) /
((rate(pg_stat_database_blks_hit[$__interval]) +
rate(pg_stat_database_blks_read[$__interval]))>0)) < 80
#9 Memory available
The solution for a low hit rate is increasing the memory usage of your instance. But this is not always possible due to potential memory limitations. So, first, we need to be sure that we have enough available memory.
Kubernetes
You can combine the total memory available for your instance (kube_pod_container_resource_limits{resource="memory"}) with the memory being used (container_memory_usage_bytes{container!="POD",container!=""}).
Let’s write a PromQL to use those metrics to get the total available memory
sum by(namespace,pod,container)(kube_pod_container_resource_limits{resource="memory"}) - sum by(namespace,pod,container)(container_memory_usage_bytes{container!="POD",container!=""})
With this information, now you can assure how much memory usage you can increment for your instance.
AWS RDS PostgreSQL instance
If you are using AWS RDS PostgreSQL, then it’s really easy to know the available disk space: just use the aws_rds_freeable_memory_average metric!
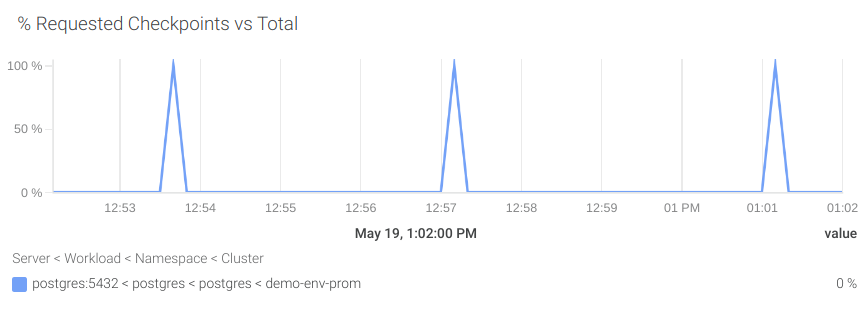
#10 Requested buffer checkpoints
PostgreSQL uses the buffer checkpoints to write the dirty buffers on disk, so it creates safe points for the Write Ahead Log (WAL). These checkpoints are scheduled periodically but also can be requested on-demand when the buffer runs out of space.
A high number of requested checkpoints compared to the number of scheduled checkpoints can impact directly the performance of your PostgreSQL instance. To avoid this situation you could increase the database buffer size.
Please note that increasing the buffer size will also increase the memory usage of your PostgreSQL instance. Check your memory availability in the previous step.
Let’s create a PromQL query to visualize the percentage of the scheduled checkpoints (pg_stat_bgwriter_checkpoints_timed) compared with the total of both scheduled and requested checkpoints (pg_stat_bgwriter_checkpoints_req).
rate(pg_stat_bgwriter_checkpoints_req[5m]) /
(rate(pg_stat_bgwriter_checkpoints_req[5m]) + rate(pg_stat_bgwriter_checkpoints_timed[5m])) * 100
That was nice, but where are my PostgreSQL monitoring dashboards?
In this article, we introduced PostgreSQL monitoring with Prometheus, using postgres_exporter. It doesn’t matter if you run your own PostgreSQL instance in Kubernetes, or in an AWS RDS PostgreSQL instance. We also introduced the Top 10 metrics in PostgreSQL monitoring with Prometheus cheat sheet.
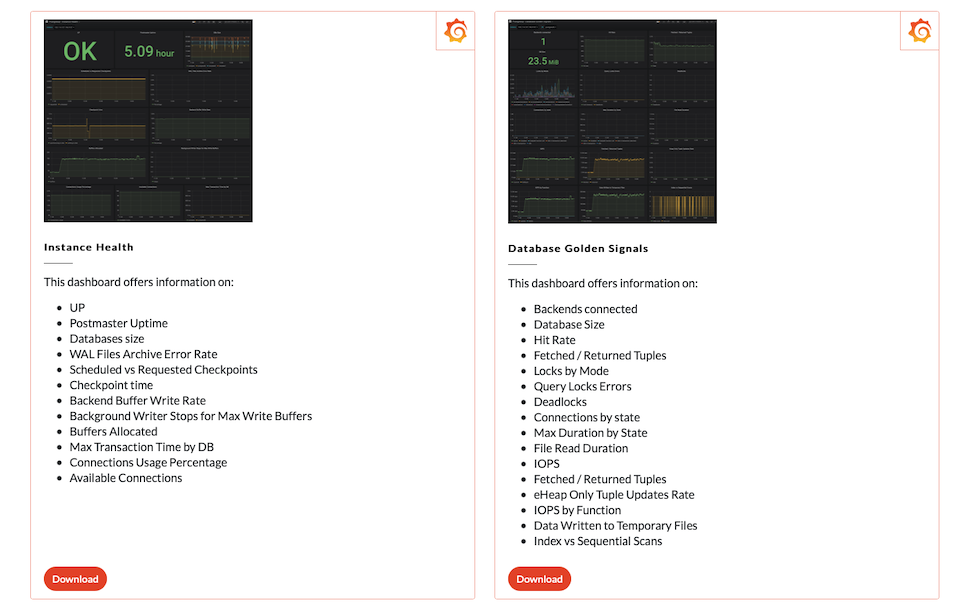
You can now download the already configured PostgresSQL monitoring dashboards from PromCat and add them to your Grafana installation (or to Sysdig Monitor!)