
In this article, we will show how it’s easily possible to monitor AWS Fargate with Sysdig Monitor. By leveraging existing Prometheus ingestion in Sysdig, you will be able to monitor serverless services with a single-pane-of-glass approach, giving you confidence in running these services in production.
Having trouble scaling Prometheus monitoring?
Watch our on-demand webinar, where we share our experience using Prometheus at scale, providing different solutions and highlighting the challenges to solve in each step:
Cloud Native Monitoring: Scaling Prometheus →
The rise of serverless
Currently, we are witnessing the rise of serverless computing, such as AWS Fargate. This service alleviates the need for developers to manage container infrastructure by leaving it to the cloud provider. By leveraging AWS Fargate for automatic management of compute infrastructure, developers can increase the speed in which they develop and deploy code. Developers have been able to use AWS Fargate on ECS for a while, and recently, Fargate was also released for EKS. Support for a Kubernetes environment gives developers more options to deploy Fargate services, including a standardized Kubernetes API.
Once these services become part of the business, they need to be monitored the same as any other production workload to ensure their health and performance. But the pods deployed in Fargate have some limitations. One of them is that Fargate does not allow privileged pods. So, how can you monitor AWS Fargate and other serverless services if you can’t install the Sysdig agent on them? We’ll need to rely on an intermediary like AWS CloudWatch, the monitoring service of Amazon.
AWS Fargate and Prometheus
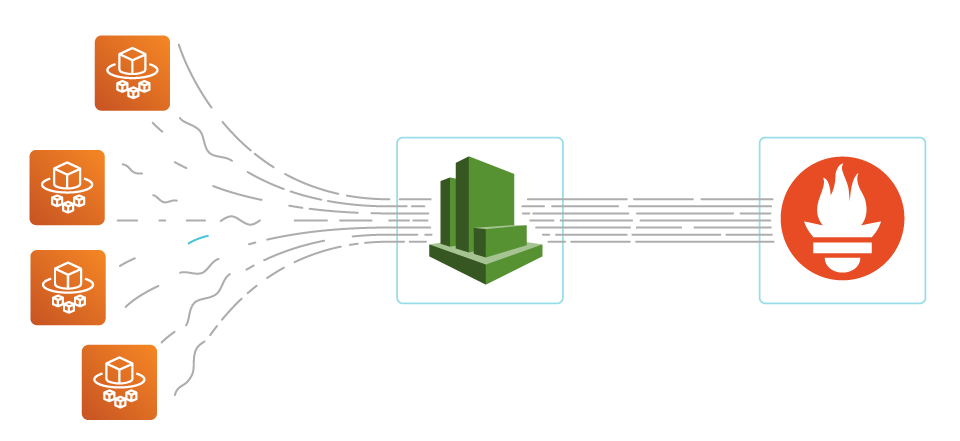
AWS Fargate is a serverless service that enables customers to run containers with computational capacity specified by the user. This way, they spend only the amount of resources that they need. CloudWatch is a tool that provides metrics to monitor Fargate and other AWS services. The AWS CloudWatch service can gather the metrics that Fargate containers generate under the namespace ECS/ContainerInsights, if it’s turned on for a particular cluster, by using Fargate.
Prometheus is a leading open source monitoring solution which provides means to easily create integrations by writing exporters. With Prometheus, you can gather metrics from your whole infrastructure which may be spread across multiple cloud providers, following a single-pane-of-glass approach.
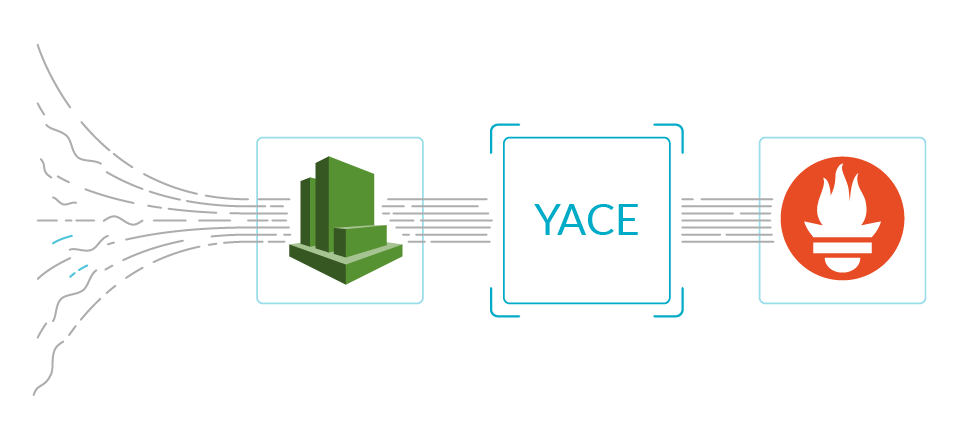
Prometheus exporters gather metrics from services and publish them in a standardized format that both a Prometheus server and the Sysdig Agent can scrape natively. We will use one of these exporters, namely yet-another-cloudwatch-exporter, to get metrics from AWS CloudWatch. We contributed to this exporter to make it more efficient and reliable.
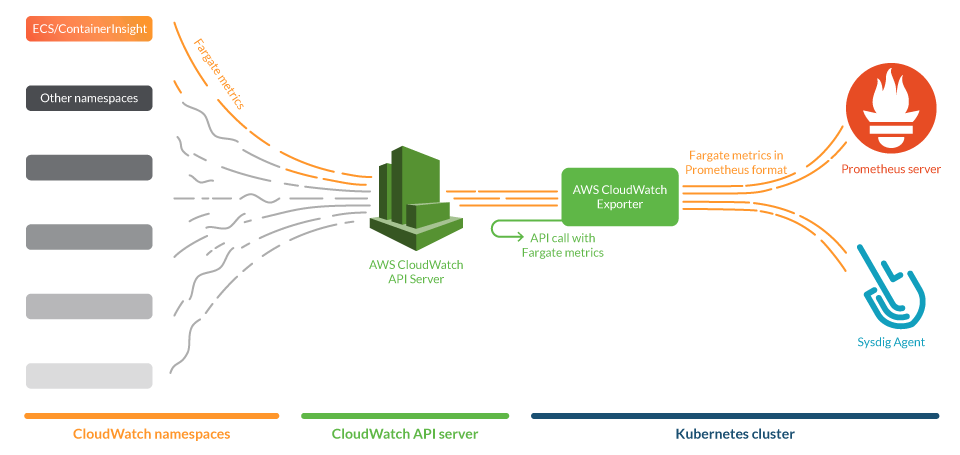
In this use case, we will deploy the CloudWatch exporter in a Kubernetes cluster and configure it to gather metrics of Fargate clusters in AWS. This exporter will be conveniently annotated with Prometheus tags, so both a Prometheus server and the Sysdig agent can scrape it. In the figure below, we show an overall view of the system.
Installing and configuring Prometheus CloudWatch exporter
The exporter connects to the AWS CloudWatch API and asks for metrics, but to get the correct answer we need to configure some permissions. In this section, we will explain the steps to configure your AWS account with the permissions and credentials to make this connection possible.
Setting up permissions to access CloudWatch metrics
First, you will need to create an AWS IAM policy that contains the following permissions:
{
    "Version": "2012-10-17",
    "Statement": [
        {
            "Sid": "CloudWatchExporterPolicy",
            "Effect": "Allow",
            "Action": [
                "tag:GetResources",
                "cloudwatch:ListTagsForResource",
                "cloudwatch:GetMetricData",
                "cloudwatch:ListMetrics"
            ],
            "Resource": "*"
        }
    ]
}
configuration of the AWS IAM policy
You will also need to supply the credentials for an AWS IAM account to the CloudWatch exporter. This can be done in a standard manner, via $HOME/.aws/credentials file.
# CREDENTIALS FOR AWS ACCOUNT
aws_region = us-east-1
aws_access_key_id = AKIAQ33BWUG3BLXXXXX
aws_secret_access_key = bXXXXXXXXXXXXXXXXXXXXXXXXXXXXXXXXX
$HOME/.aws/credentials file.
You can either assign the IAM policy directly to the IAM account or to a role to grant the permissions to the exporter.
Finally, be sure to enable Container Insights in the cluster where you deploy the Fargate tasks that you want to monitor. You can check the documentation on how to set Container Insights either in AWS ECS or AWS EKS and Kubernetes.
Configuring the exporter
We opted for the yet-another-cloudwatch-exporter (YACE), which is written in Go and has images for its stable version ready to be deployed. We recently contributed to this exporter to make it more efficient and reliable.
This exporter will fetch metrics from AWS CloudWatch and expose them in the standard Prometheus metrics format. Then, they can be scraped by the prometheus ingest component of Sysdig agent or by a Prometheus server.
The YACE exporter can gather metrics from any CloudWatch namespace. So, to monitor AWS Fargate, you just need to define the correct namespace and metrics to select the Fargate metrics that you want to scrape.
In order to do so, you initially need to create a configuration file for the exporter. In this configuration, you will define which metrics the exporter will scrape, and from which region and what dimensions we’ll ask CloudWatch to make the aggregations with.
For example, in this case, we will use the region us-east-1 and we’ll ask CloudWatch to use the dimension ServiceName to aggregate the metrics.
Here’s an example config.yml configuration file:
discovery:
  jobs:
  - regions:
    - us-east-1
    type: ecs-containerinsights
    enableMetricData: true
    metrics:
      - name: ContainerInstanceCount
        statistics:
        - Average
        period: 300
        length: 3600
      - name: ServiceCount
        statistics:
        - Average
        period: 300
        length: 3600
  - regions:
    - us-east-1
    type: ecs-containerinsights
    enableMetricData: true
    awsDimensions:
      - ServiceName
    metrics:
      - name: CpuReserved
        statistics:
        - Average
        period: 300
        length: 3600
      - name: CpuUtilized
        statistics:
        - Average
        period: 300
        length: 3600
      - name: MemoryReserved
        statistics:
        - Average
        period: 300
        length: 3600
      - name: MemoryUtilized
        statistics:
        - Average
        period: 300
        length: 3600
      - name: StorageReadBytes
        statistics:
        - Average
        period: 300
        length: 3600
      - name: StorageWriteBytes
        statistics:
        - Average
        period: 300
        length: 3600
      - name: NetworkRxBytes
        statistics:
        - Average
        period: 300
        length: 3600
      - name: NetworkTxBytes
        statistics:
        - Average
        period: 300
        length: 3600
      - name: DesiredTaskCount
        statistics:
        - Average
        period: 300
        length: 3600
      - name: TaskCount
        statistics:
        - Average
        period: 300
        length: 3600
      - name: PendingTaskCount
        statistics:
        - Average
        period: 300
        length: 3600
      - name: RunningTaskCount
        statistics:
        - Average
        period: 300
        length: 3600
      - name: DeploymentCount
        statistics:
        - Average
        period: 300
        length: 3600
      - name: TaskSetCount
        statistics:
        - Average
        period: 300
        length: 3600
Sample config.yml file of the CloudWatch exporter.
Note that in the configuration file, the parameter enableMetricData is set to true. This is used because this API function allows the exporter to scrape several metrics in a single call. This is important to prevent throttling scenarios to the CloudWatch API that can block the AWS API service.
Please be aware of the following caveats:
- If you wish to add an additional metric, be sure to read up on AWS ECS Insights Metrics to use the correct statistic.
- CloudWatch offers aggregations on different dimensions, so don’t forget to specify which ones you need and check they are supported in the AWS docs for Fargate. If you ask for incorrect dimensions, CloudWatch will return no data.
- Gathering CloudWatch metrics may incur a certain cost to the AWS bill. Take care to check the AWS Documentation on CloudWatch service Quota limits.
Once you have the IAM account credentials and the configuration file ready, you can create a Kubernetes file like the following:
apiVersion: v1
kind: Namespace
metadata:
  name: yace
---
apiVersion: apps/v1
kind: Deployment
metadata:
  name: yace-fargate
  namespace: yace
spec:
  selector:
    matchLabels:
      app: yace-fargate
  replicas: 1
  template:
    metadata:
      labels:
        app: yace-fargate
      annotations:
        prometheus.io/scrape: "true"
        prometheus.io/port: "5000"
    spec:
      containers:
      - name: yace
        image: quay.io/invisionag/yet-another-cloudwatch-exporter:v0.16.0-alpha
        ports:
        - containerPort: 5000
        volumeMounts:
          - name: yace-fargate-config
            mountPath: /tmp/config.yml
            subPath: config.yml
          - name: yace-fargate-credentials
            mountPath: /exporter/.aws/credentials
            subPath: credentials
        resources:
          limits:
            memory: "128Mi"
            cpu: "500m"
      volumes:
        - configMap:
            defaultMode: 420
            name: yace-fargate-config
          name: yace-fargate-config
        - secret:
            defaultMode: 420
            secretName: yace-fargate-credentials
          name: yace-fargate-credentials
---
apiVersion: v1
kind: ConfigMap
metadata:
  name: yace-fargate-config
  namespace: yace
data:
  config.yml: |
    discovery:
      jobs:
      - regions:
        - us-east-1
        type: ecs-containerinsights
        enableMetricData: true
        metrics:
          - name: ContainerInstanceCount
            statistics:
            - Average
            period: 300
            length: 3600
          - name: ServiceCount
            statistics:
            - Average
            period: 300
            length: 3600
      - regions:
        - us-east-1
        type: ecs-containerinsights
        enableMetricData: true
        awsDimensions:
          - ServiceName
        metrics:
          - name: CpuReserved
            statistics:
            - Average
            period: 300
            length: 3600
          - name: CpuUtilized
            statistics:
            - Average
            period: 300
            length: 3600
          - name: MemoryReserved
            statistics:
            - Average
            period: 300
            length: 3600
          - name: MemoryUtilized
            statistics:
            - Average
            period: 300
            length: 3600
          - name: StorageReadBytes
            statistics:
            - Average
            period: 300
            length: 3600
          - name: StorageWriteBytes
            statistics:
            - Average
            period: 300
            length: 3600
          - name: NetworkRxBytes
            statistics:
            - Average
            period: 300
            length: 3600
          - name: NetworkTxBytes
            statistics:
            - Average
            period: 300
            length: 3600
          - name: DesiredTaskCount
            statistics:
            - Average
            period: 300
            length: 3600
          - name: TaskCount
            statistics:
            - Average
            period: 300
            length: 3600
          - name: PendingTaskCount
            statistics:
            - Average
            period: 300
            length: 3600
          - name: RunningTaskCount
            statistics:
            - Average
            period: 300
            length: 3600
          - name: DeploymentCount
            statistics:
            - Average
            period: 300
            length: 3600
          - name: TaskSetCount
            statistics:
            - Average
            period: 300
            length: 3600
---
apiVersion: v1
kind: Secret
metadata:
  name: yace-fargate-credentials
  namespace: yace
data:
  # Add in credentials the result of:
  # cat ~/.aws/credentials | base64
  credentials: |
    XXXXX
In this file, we can find:
- Namespace ‘yace’
- Deployment with the exporter. This deployment has two volumes, one with the configuration file and another with the credentials. Note that the deployment is annotated with the Prometheus tags for scraping and scraping port.
- ConfigMap of the configuration of the exporter.
- Secret with the credentials of the IAM account.
For a quick test, we can take a look at the CloudWatch exporter by forwarding the port 5000 of the pod yace-fargate and browse the page at:
http://<our machine>:5000/metrics
If everything goes OK, you should see a web page with a metric of this kind (output truncated due to size):
# HELP aws_ecs_containerinsights_cpu_reserved_average Help is not implemented yet.
# TYPE aws_ecs_containerinsights_cpu_reserved_average gauge
aws_ecs_containerinsights_cpu_reserved_average{dimension_ClusterName="damir-test-cloudwatch",dimension_ServiceName="nginx",name="arn:aws:ecs:us-east-1:XXXXXXXXXX:cluster/ECS-Nirav",region="us-east-1"} 256
aws_ecs_containerinsights_cpu_reserved_average{dimension_ClusterName="damir-test-cloudwatch",dimension_ServiceName="nginx",name="arn:aws:ecs:us-east-1:XXXXXXXXXX:cluster/damir-test-cloudwatch",region="us-east-1"} 256
aws_ecs_containerinsights_cpu_reserved_average{dimension_ClusterName="damir-test-cloudwatch",dimension_ServiceName="nginx",name="arn:aws:ecs:us-east-1:XXXXXXXXXX:cluster/garrick-tam-ECS-case4154-repro",region="us-east-1"} 256
# HELP aws_ecs_containerinsights_cpu_utilized_average Help is not implemented yet.
# TYPE aws_ecs_containerinsights_cpu_utilized_average gauge
aws_ecs_containerinsights_cpu_utilized_average{dimension_ClusterName="damir-test-cloudwatch",dimension_ServiceName="nginx",name="arn:aws:ecs:us-east-1:XXXXXXXXXX:cluster/ECS-Nirav",region="us-east-1"} 0.03375506236035767
aws_ecs_containerinsights_cpu_utilized_average{dimension_ClusterName="damir-test-cloudwatch",dimension_ServiceName="nginx",name="arn:aws:ecs:us-east-1:XXXXXXXXXX:cluster/damir-test-cloudwatch",region="us-east-1"} 0.03375506236035767
aws_ecs_containerinsights_cpu_utilized_average{dimension_ClusterName="damir-test-cloudwatch",dimension_ServiceName="nginx",name="arn:aws:ecs:us-east-1:XXXXXXXXXX:cluster/garrick-tam-ECS-case4154-repro",region="us-east-1"} 0.03375506236035767
Monitoring AWS Fargate tasks: What to look for?
Number of tasks in different states: These metrics are especially useful to address the health of your services and the utilization of the resources in your cluster. CloudWatch offers metrics to monitor the number of Fargate tasks in running state, pending state and desired tasks. Monitoring the number of tasks in different states gives a quick view of the usage of the service:
aws_ecs_containerinsights_pending_task_count_average
aws_ecs_containerinsights_running_task_count_average
aws_ecs_containerinsights_desired_task_count_average
CPU and Memory usage: Other important metrics to monitor are the usage of CPU and memory. In Fargate, it’s important to reserve both CPU and memory for the task defined. This will help lower the usage and billing of the service, as this is calculated by the resources that the tasks use.
It’s important to set the correct amount of both CPU and memory. Setting a higher reservation of resources than needed will cause an under-utilization of resources that you will be paying for. On the other hand, reserving too little will cause performance problems in the containers.
To address this, CloudWatch offers the following metrics for CPU, memory use and capacity:
aws_ecs_containerinsights_cpu_utilized_average
aws_ecs_containerinsights_cpu_reserved_average
aws_ecs_containerinsights_memory_utilized_average
aws_ecs_containerinsights_memory_reserved_average
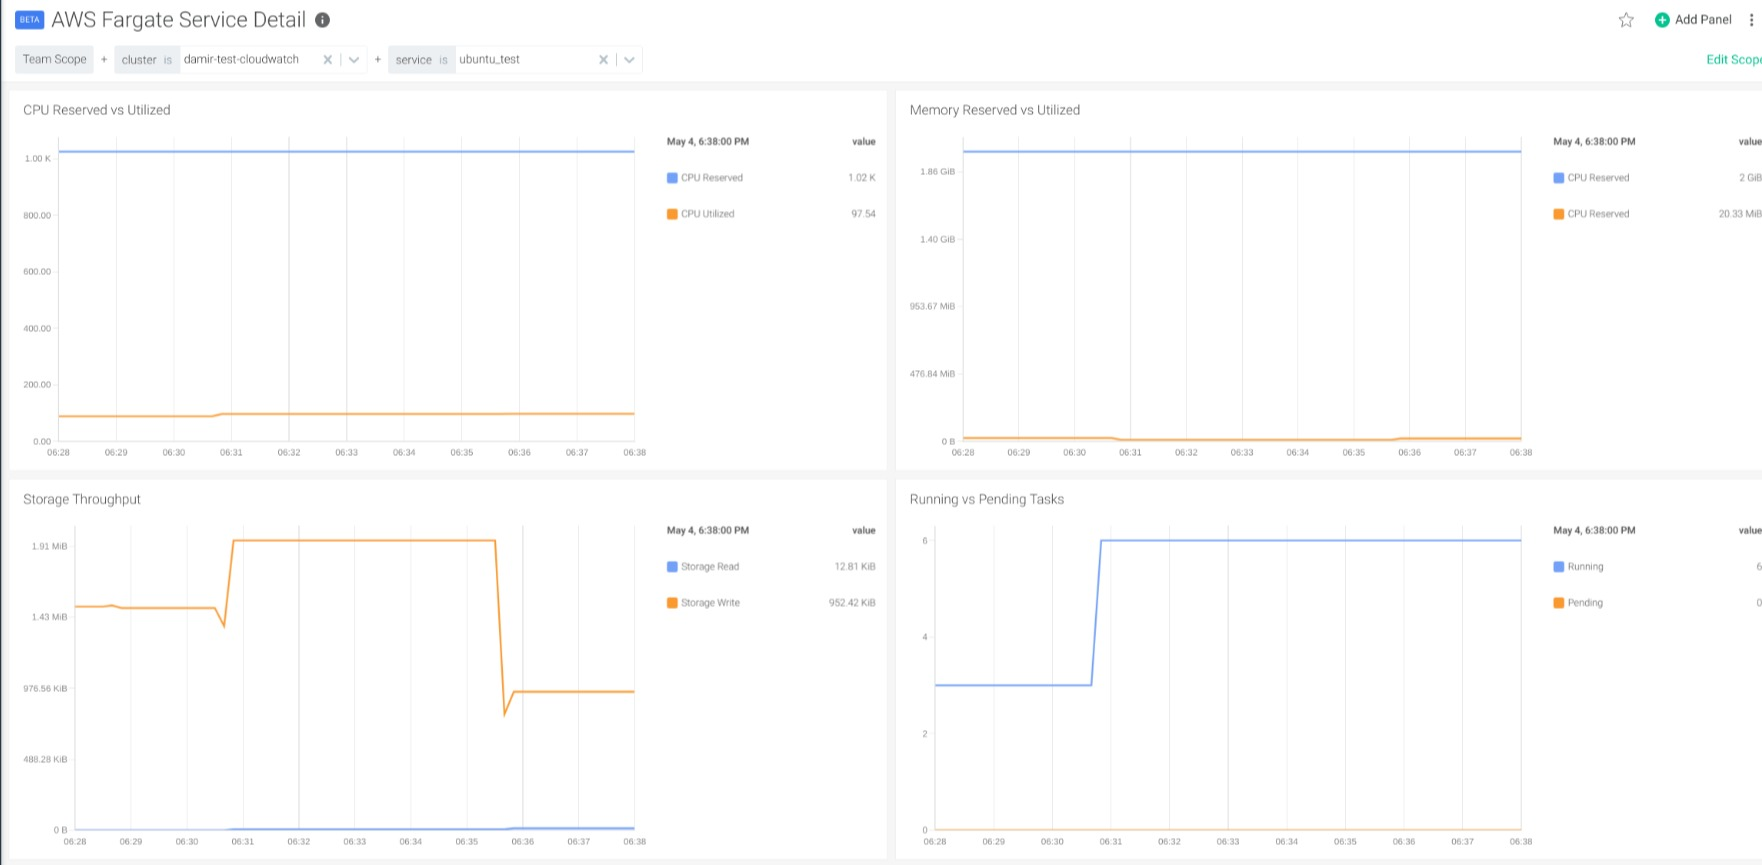
The Cluster Overview dashboard provides panels to detect tasks with high utilization of CPU and memory. Also, in the Service Detail Dashboard, you can explore the usage of resources by a single service to properly adjust the reservation of memory and CPU, as well as optimize the utilization of resources in your cluster.
Monitoring disk usage and network performance: Finally, these dashboards also give you information on the disk utilization of the tasks. Additional metrics for network usage are available for tasks using bridge network mode. Disk and network utilization metrics can be used for troubleshooting and evaluation of the performance.
Possible issues and alerts to detect them
Tasks in crash loop back off: You can set an alarm to detect recurrent pending tasks in the cluster for a period of time, and to detect tasks that are experiencing recurring problems in their initialization. The following promQL sentence will alert when there are pending tasks of a certain service:
aws_ecs_containerinsights_pending_task_count_average > 0
Unprogrammed failures or spikes in the number of tasks: You can also set custom alarms to alert when the number of running tasks of certain services are under or over certain values, as well as to detect failures on services or unprogrammed spikes in the number of tasks. This promQL detects when a specific service in a cluster has less than five tasks in running state.
aws_ecs_containerinsights_running_task_count_average{dimension_ClusterName='clusterName', dimension_ServiceName='serviceName'} < 5
Out Of Memory (OOM) Kills and CPU throttling: Reserving less CPU than needed will cause CPU throttling in the task with problems in performance, while reserving less memory than needed would cause OOM kill problems. This promQL detects when a service is using over 75 percent of the reserved memory.
avg by (dimension_ServiceName)(aws_ecs_containerinsights_memory_utilized_average / aws_ecs_containerinsights_memory_reserved_average) > 0.75
And this second promQL detects services with 75 percent of their CPU capacity utilized:
avg by (dimension_ServiceName)(aws_ecs_containerinsights_cpu_utilized_average / aws_ecs_containerinsights_cpu_reserved_average) > 0.75
Caveats and further improvements
This was a simplistic presentation of how to monitor AWS Fargate using a Prometheus exporter to obtain custom metrics with little effort.
Some caveats and limitations still remain:
- In clusters with a high number of tasks, there may be also a high number of metrics provided by CloudWatch. This can translate into unexpected bills of CloudWatch usage. To avoid this, the CloudWatch exporter that we presented can be configured to filter the resources that will ask for metrics by tags. For example, maybe you can be interested in metrics for the production environment, but not from the development environment.
- In this example, we configured the exporter to ask for metrics with a granularity of 300 seconds. This is because the exporter has a functionality that allows it to proxy the calls to CloudWatch every 300 seconds by default. However, this can be changed and adjusted for different values. Filtering your services by tags, you can set a 60 seconds granularity and proxy refreshing of the data for critical tasks where five minutes is not enough, and one hour granularity for other, less critical services. This way, you can optimize the billing of your CloudWatch account.
- In this example, we included the most relevant metrics available for Fargate. However, you can customize the configuration to drop some metrics if you don’t need them, or to include others.
Getting the CloudWatch metrics into Sysdig Monitor
Sysdig agent setup
In this section, we will show you how to get these metrics into Sysdig Monitor. It’s fairly easy and requires a minimum configuration of the Sysdig Agent, once installed, so it captures Prometheus metrics.
Here is some sample code that you have to insert in the file /opt/draios/etc/dragent.yaml that will perform the scraping of the container with the exporter:
10s_flush_enable: true
use_promscrape: true
prometheus:
 enabled: true
 histograms: true
 ingest_raw: true
 ingest_calculated: false
 interval: 10
 log_errors: true
 max_metrics: 3000
 max_metrics_per_process: 20000
snaplen: 512
tags: role:cluster
The main items include:
- Turning on prometheus metrics gathering.
- Specifying the process filter for prometheus scraper. Note that the Prometheus annotations for scrape, path and port are also defined in the command that launched the exporter.
Once the configuration is saved, the agent will pick it up automatically.
In a few minutes, the metrics will start trickling in and will be visible in the Sysdig Monitor interface.
Monitoring AWS Fargate with dashboard and alerts
Once we have Fargate metrics in Sysdig Monitor, we can use dashboards to visualize them. To do so, Sysdig offers a general overview and a detailed dashboard. The Cluster Overview Dashboard gives a general overview of the overall behavior of the tasks in our clusters and lets you easily identify potential problems.
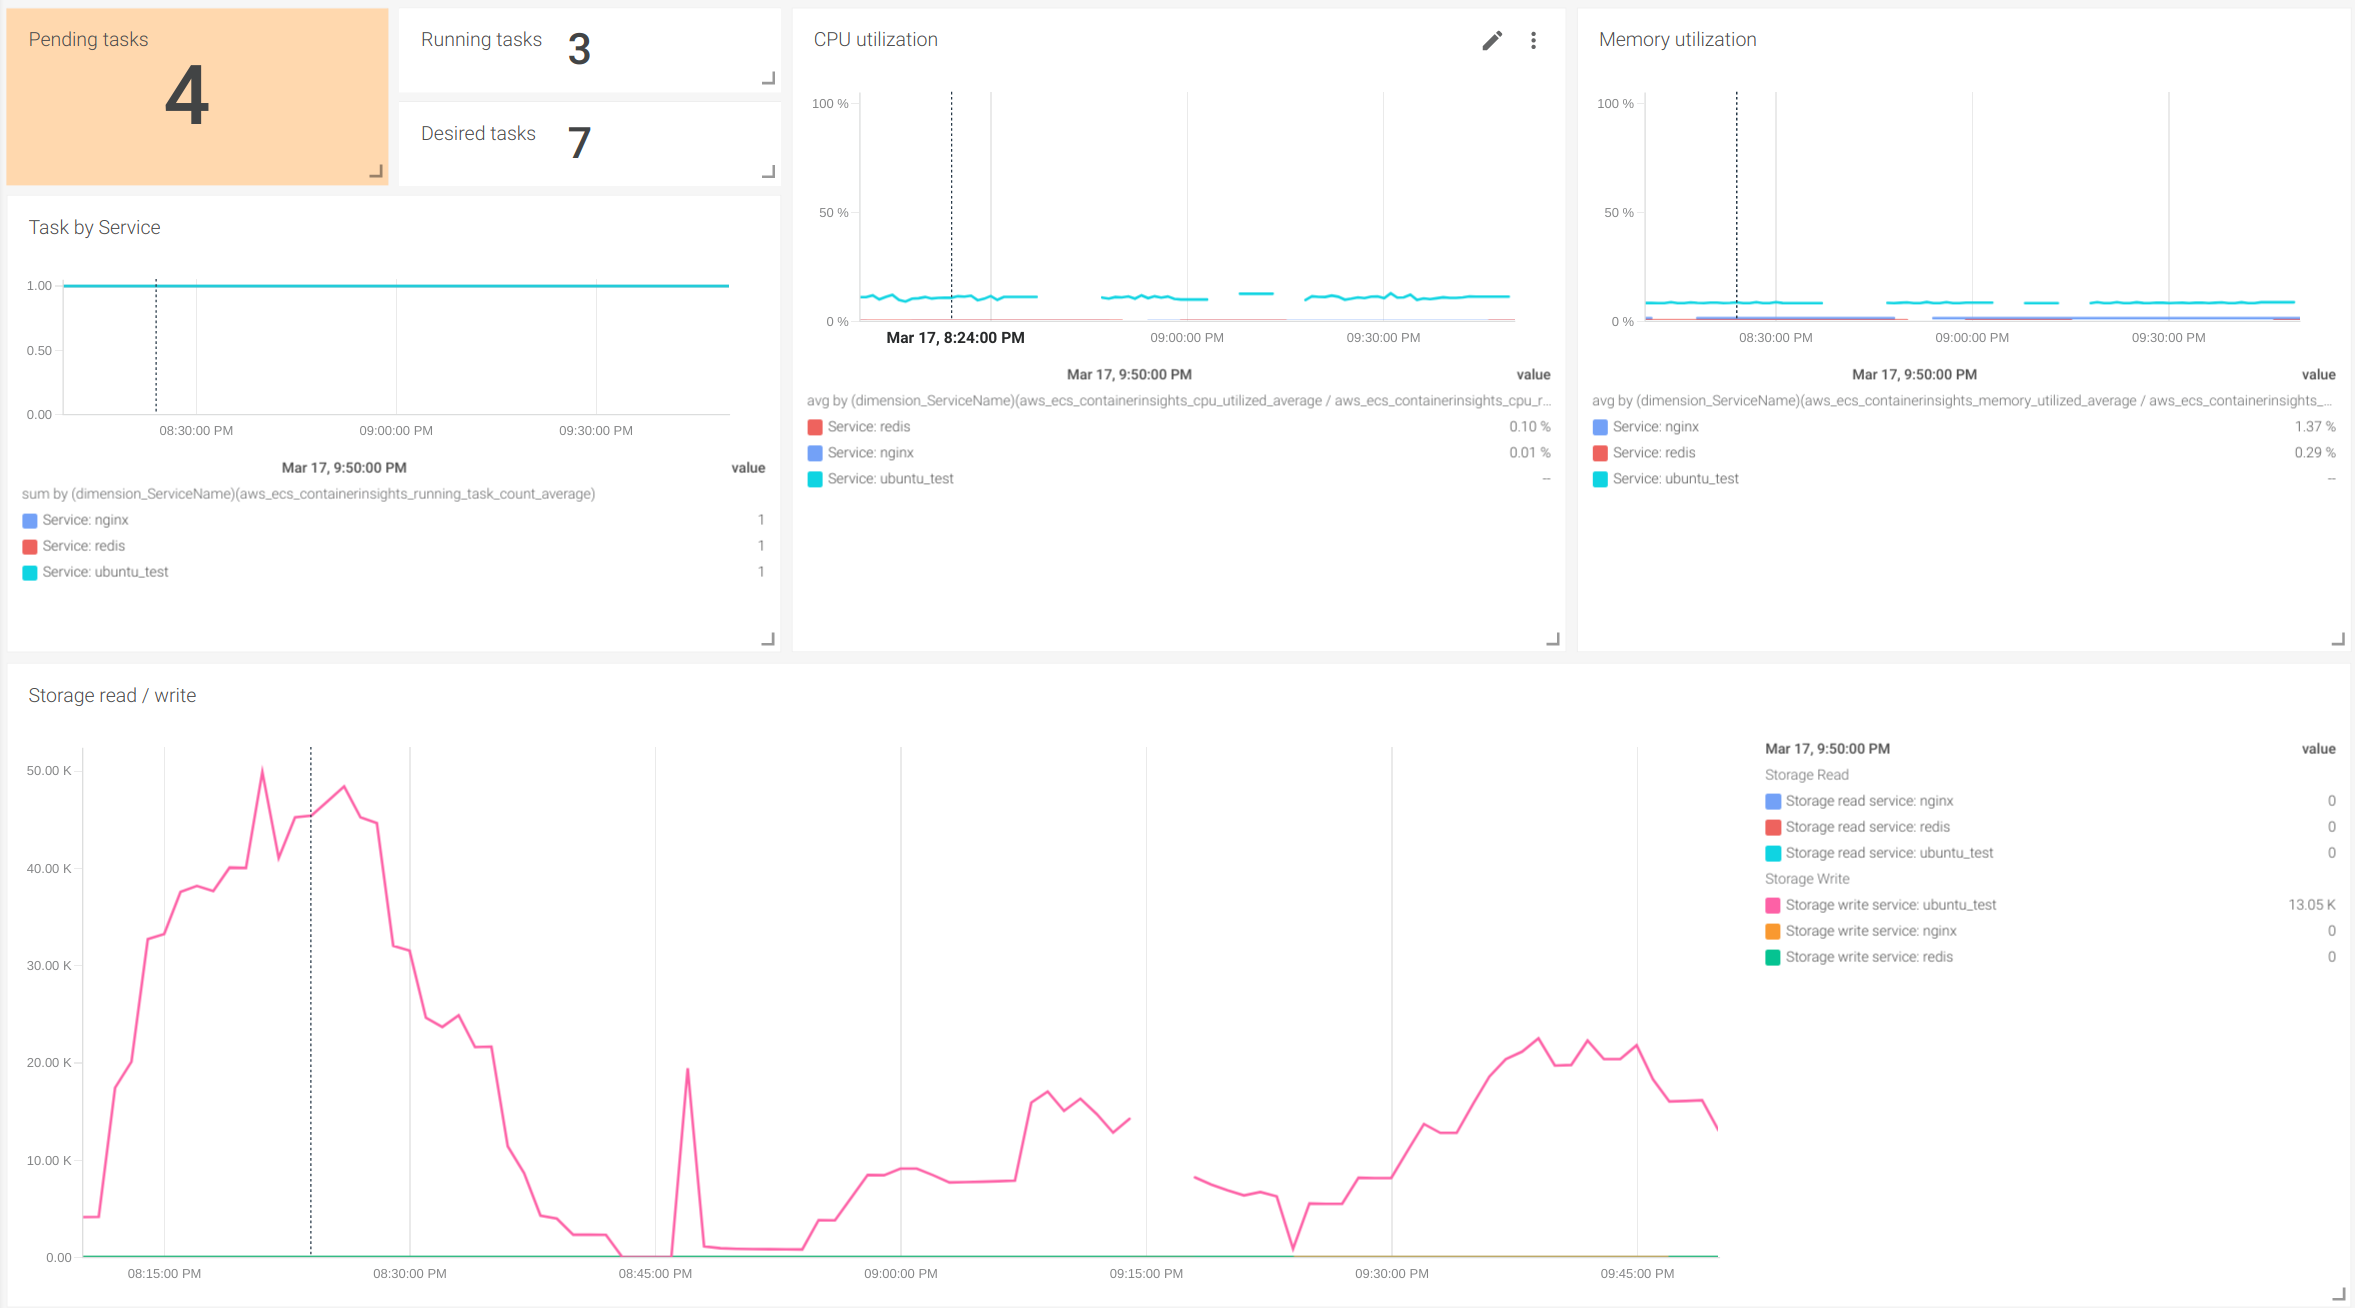
In the Service Detail Dashboard, you can use the variables to select both the cluster and the service that you want to inspect in detail.
Conclusion
Hopefully, we’ve demonstrated that it’s really easy to monitor AWS Fargate by integrating CloudWatch metrics into Sysdig Monitor. This is possible by having a standardized interface to natively ingest Prometheus metrics and leverage existing exporters, like the CloudWatch exporter that we presented in this article.
If you would like to try this integration, we invite you to sign-up for a free trial.
You can also find instructions on how to install the exporter and ready-to-use configurations to monitor AWS Fargate in PromCat.io. There, you will also find the dashboards that we presented in both Grafana and Sysdig format, as well as examples of alerts for your services.
You can learn more about our Prometheus integration in our documentation or our blog.